As a researcher that started his career in experimental biochemistry, my road to artificial intelligence had more to do with fate than what I am normally willing to admit.
During my PhD training in the first half of 2000's, I made extensive use of computational tools for for a variety of tasks, but invariably an out-of-the-box software solution was all that was required. These were early days of "Big Data" in the field of biology, with the first large genome sequencing projects grabbing the headlines in high profile scientific publications as well as in popular media. Laboratory automation was a reality, but in an average lab you would normally be restricted to the auto sampler system of some analytical device. Up to that time, handling large datasets was mostly of concern to physicists working on the molecular and quantum details of matter, perhaps also meteorologists attempting to model weather patterns, as well as many people in the business sector trying to gain an extra buck by predicting the next stock market crunch (which they still haven't quite figured out yet!). As these developments were taking place, your average biologist working in the lab is happy if he can access large repositories of data, including literature databases, as well as protein and gene sequence information, which grow though the input of thousands of researchers world-wide. At this moment in time, most researchers do not get first hands on "Big Data", but they access it though online platforms. This was then a new level of information sharing that allowed a researcher to quickly place his/her own results within a larger context, and from that derive more meaning than otherwise it would be possible to do.
 |
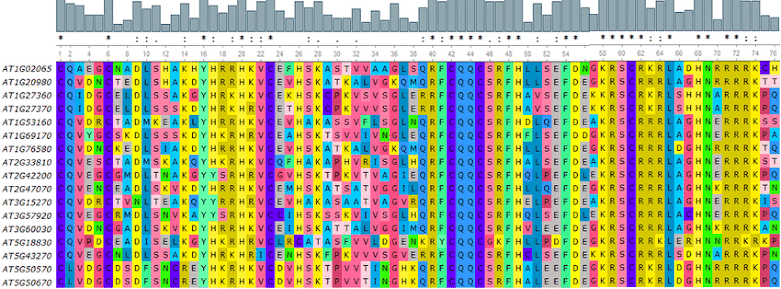
| Example of a multiple sequence alignment where several protein or gene sequences can be compared, regions of low and high variability can be identified, and from which homology-based clustering can be performed. Image source here. |
In those days, instrumentation was invariably low throughput, but we were happy, because we didn't know any better. As a young researcher, interacting with machines with huge magnetic coils while handling liquid helium to produce temperatures closer to those found in outer space was intimidating and exciting enough. The analysis of a single spectrum produced by such instruments was enveloped in an aura os mystery, as if a stranger kept slipping under my door letters written in code that required to be deciphered. "What does this all mean?" - I asked myself so many times.
A few years pass, and I find myself in my first post-doc position working in a lab specialized in protein crystallography trying to understand molecular transitions in protein aggregation and their role in diseases like Alzheimer's, Parkinson's and several more. The group had then started a collaboration with another team based in Hungary specialized in manipulation of single molecules using atomic force microscopy (AFM), and I was the person in charge of connecting the two groups. It was amazing! The idea of being able to follow up what happens once you physically contact with a single molecule and then pull on it, stretching it out... it was über exciting. Soon I came to understand that in order to be able to detect single molecule interactions, one needs to dilute the sample enormously, so that individual molecules once deposited on a surface can be well far apart. In turn, this meant that when probing any given sample, most of the readings obtained would contain only "background" information. Therefore, any hopes of probing single molecules would require acquiring thousands of datasets, which could be easily accomplished in a couple of hours, but then to be processed and analyzed one-by-one later one... as you can imagine, this necessity marks the beginning of my road into computer programming.


Comments
Post a Comment